THIS IS A BLOG FOR MR. KELLY'S MATH CLASS
Pre Calc
The following graphs represent the velocity of a skateboard rolling down three different height ramps and up a 64 ft. driveway. Each graph has two lines graphed. The first line, the orange one, is a guess of what I expected the graph to look like, and the second line, the black one, is the actual graph of the movement of the skateboard. 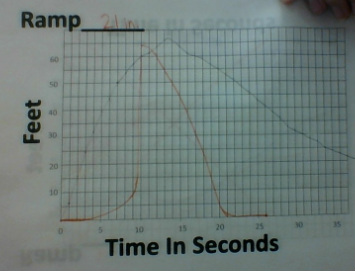 21 INCH RAMP I predicted that the skateboard sped up very slowly then immediately turned around very quickly once it got to the top of the driveway, but it actually accelerated quickly and slowly turned around. I was not very close on this graph... The domain of this graph is (0,37)s. The range is (0,66)m. It has a maximum at about 65m, which means that the furthest displacement that the skateboard reached was 65 meters. It has a minimum of 0 meters, which means that the least amount of displacement that the skateboard achieved was 0 meters. 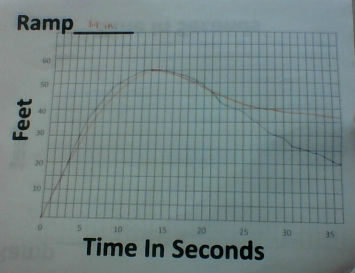 14 INCH RAMP My prediction for this graph was much closer than the first graph. I predicted that the skateboard sped up quickly at first, then its velocity gradually decreased until it reached 56 meters and turned around and upheld a negative velocity until the end. The domain of this graph is (0,37)s. The range is (0,56)m. It has a maximum of about 56m, which means that the furthest displacement that the skateboard reached was 56 meters. It has a minimum of 0m, which means that the least amount of displacement that the skateboard achieved was 0 meters. 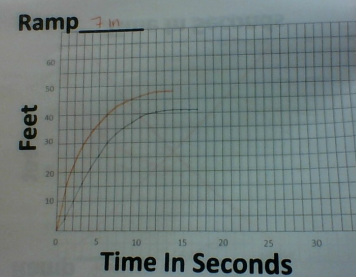 7 INCH RAMP I predicted a similar graph for this test, but predicted a higher velocity than that of the actual graph. The skateboard during this trial again sped up quickly (not as quickly as on the steeper ramps), then gradually slowed down to a velocity of 0. The domain of this graph is (0,17)s. The range is (0,48)m. It has a maximum of about 48m, which means that the furthest displacement that the skateboard reached was 48 meters. It has a minimum of 0m, which means that the least amount of displacement that the skateboard achieved was 0 meters (even though this time the graph doesn't go back down, the initial position of the skateboard was 0 meters).
0 Comments
 This is a beautiful creating that I made using Desmos.com, a website used to create graphs. I created this graph that I named "Flower Power" using quadratic functions, one circle equation, and lines, then changed some of the equals signs to greater than and less than signs to create the shading effect that made it seem as though there is petals of a flower.
Link to my graph at Desmos.com: https://www.desmos.com/calculator/zu6astc0fb | AuthorWrite something about yourself. No need to be fancy, just an overview. ArchivesMarch 2015 Categories |
 RSS Feed